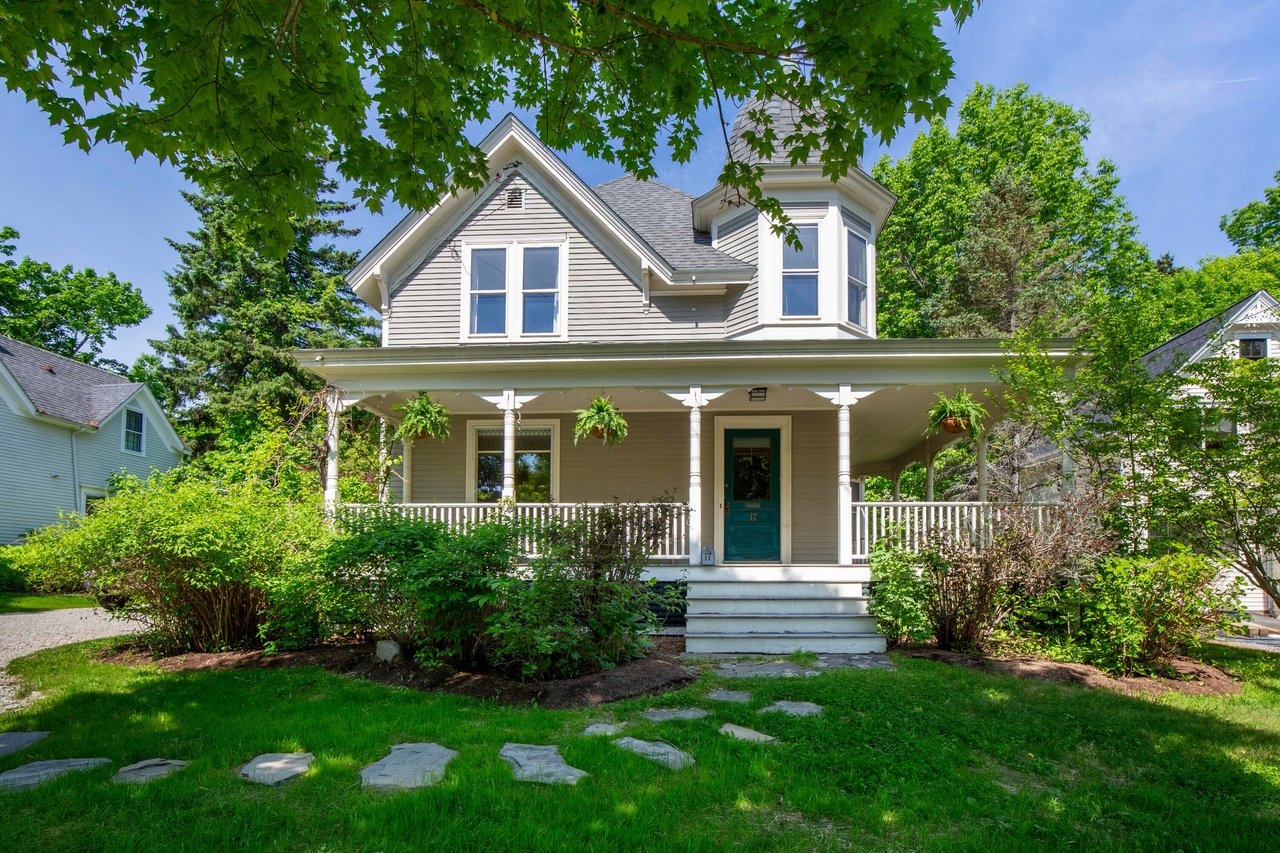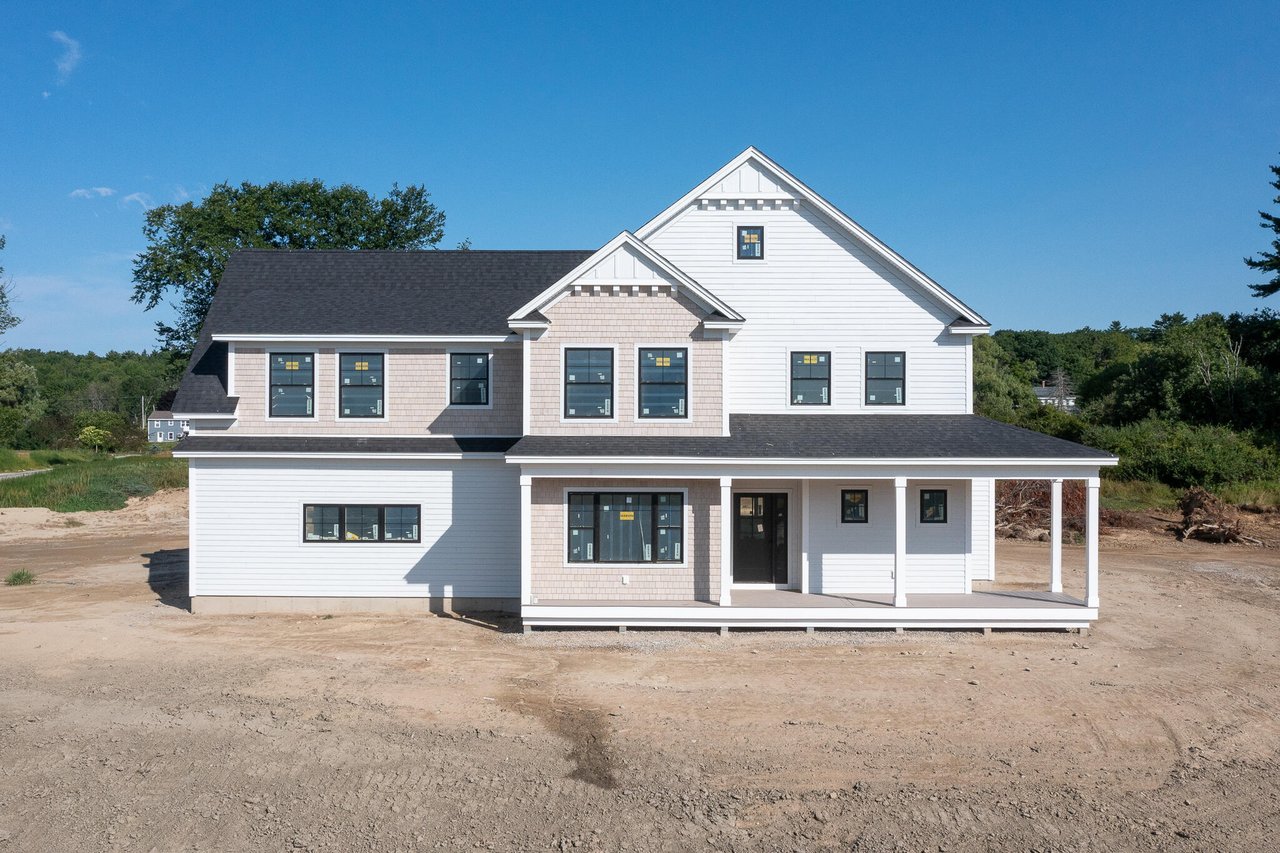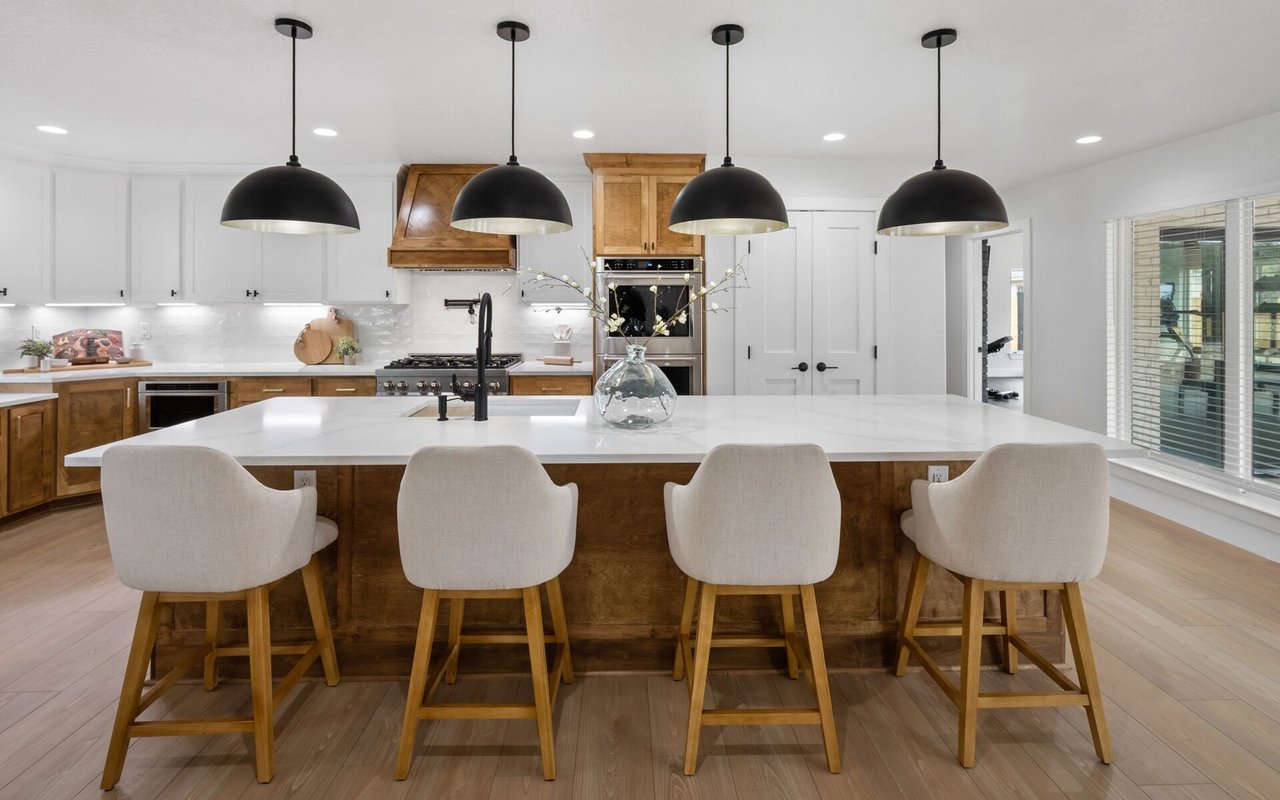
• Purchases of new homes in February climbed to the fastest pace in seven years despite severe weather. Purchases of new homes rose 7.8 percent from a month earlier to a seasonally adjusted annual rate (SAAR) of 539,000 in February. This was 24.8 percent higher than a year earlier and the strongest pace since February 2008. January sales were revised upward to a pace of 500,000. New home sales data can be volatile, however, and are often revised. (Source: HUD and Census Bureau.)
• Homeowners’ Equity continues to rise. Homeowners’ equity (total property value less mortgage debt outstanding) was up nearly $260 billion (2.4%) from the third quarter, reaching nearly $11.3 trillion, the highest level since the second quarter of 2007. In the third quarter of 2014, the increase in owners’ equity was nearly $176 billion. The change in equity since April 1, 2009, when the Administration initiated its broad set of actions to stabilize the housing market, now stands at nearly $5.1 trillion (+82.2%). (Source: Federal Reserve.)
• House prices showed year-over-year gains continuing to stabilize in January. The Federal Housing Finance Agency (FHFA) seasonally adjusted purchase-only house price index for January showed home values rose 0.3 percent over the previous month and 5.1 percent over the previous year. The year-over-year house price gain in January was slightly lower than the 5.4 percent annual gain recorded in December. The FHFA index shows that U.S. home values are approximately on par with December 2005 prices and now stand just 3.5 percent below their previous peak in March 2007. Another index tracked in the Scorecard, the non-seasonally adjusted (NSA) S&P/Case-Shiller 20-City Home Price Index, posted year-over-year returns for January of 4.6 percent, slightly above the 4.4 percent pace recorded in December. The Case-Shiller index showed home values virtually unchanged from the previous month, which might be expected for a NSA index at this time of year when sales slow after the primary homebuying season (spring and summer) and house prices typically flatten or decline. (The Case-Shiller and FHFA price indices are released with a 2-month lag.)
• Foreclosure starts continue their annual downward trend. Lenders started the public foreclosure process on 47,598 U.S. properties in February, down 5 percent from revised January estimates and down 8 percent from a year earlier. With the exception of just two months, foreclosure starts have been declining on an annual basis since July 2012. (Source: RealtyTrac.)
• The Administration’s foreclosure mitigation programs continue to provide relief for millions of homeowners as the recovery from the housing crisis continues. In all, more than 9.3 million mortgage modification and other forms of mortgage assistance arrangements were completed between April 2009 and the end of February 2015. More than 2.3 million homeowner assistance actions have taken place through the Making Home Affordable Program, including nearly 1.5 million permanent modifications through the Home Affordable Modification Program (HAMP), while the Federal Housing Administration (FHA) has offered nearly 2.7 million loss mitigation and early delinquency interventions through February. These Administration programs continue to encourage improved standards and processes in the industry, with lenders offering families and individuals more than 4.3 million proprietary modifications through January (data are reported with a 2-month lag).
To View The Full Report: http://portal.hud.gov/hudportal/documents/huddoc?id=March2015_Scorecard.pdf